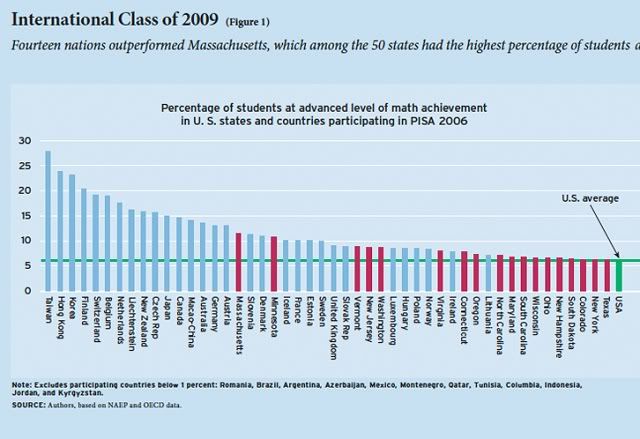
Originally Posted By: sweatybettyi think most of you here know what i think of the public indoctrination system, so i wont go there.
anyhow, wisconsin, #44. great job jeffo!
http://education.usnews.rankingsandrevie...tate-statistics
America's Best High Schools: State-by-State Statistics
Posted December 9, 2009
America's Best High Schools
ACT Composite Scores by State
2010 scores for states testing 50 percent or more of their high school graduates*
Top Ten States
State Rank Average
Composite Score % of Graduates
Tested
Minnesota 1 22.9 70
Iowa 2 22.2 60
Wisconsin 3 22.1 69
Nebraska 4 22.1 73
Montana 5 22.0 58
Kansas 6 22.0 75
South Dakota 7 21.8 79
Utah 8 21.8 71
Ohio 9 21.8 66
Idaho 10 21.8 60
Neighboring States
State Rank Average
Composite Score % of Graduates
Tested
North Dakota 12 21.5 81
Illinois 13 20.7 100
View more America's Best High Schools tables:
Rank State Number of High Schools* Number eligible for full analysis Awarded bronze or better Bronze or better medal (% of total) Awarded silver or gold Silver or gold (% of total) Awarded Gold Gold (% of total)
1 Connecticut 193 143 16 8.3% 12 6.2% 0 0.0%
2 Massachusetts 345 253 37 10.7% 21 6.1% 2 0.6%
3 California 1839 893 170 9.2% 110 6.0% 20 1.1%
4 New Jersey 397 299 41 10.3% 23 5.8% 5 1.3%
5 New York 1041 676 122 11.7% 53 5.1% 23 2.2%
6 Illinois 742 296 70 9.4% 37 5.0% 3 0.4%
7 Vermont 63 39 8 12.7% 3 4.8% 0 0.0%
8 Washington 453 211 51 11.3% 21 4.6% 4 0.9%
9 Maine 115 77 10 8.7% 5 4.3% 1 0.9%
9 Maryland** 231 173 15 6.5% 10 4.3% 0 0.0%
11 Florida 608 367 43 7.1% 24 3.9% 10 1.6%
12 New Hampshire** 78 59 8 10.3% 3 3.8% 0 0.0%
13 Rhode Island 54 21 4 7.4% 2 3.7% 0 0.0%
14 Texas 1425 669 122 8.6% 50 3.5% 11 0.8%
15 Colorado 338 146 32 9.5% 11 3.3% 1 0.3%
16 Nevada 94 54 5 5.3% 3 3.2% 0 0.0%
16 Oregon 283 100 33 11.7% 9 3.2% 0 0.0%
18 Kentucky 258 148 32 12.4% 8 3.1% 0 0.0%
19 North Carolina 440 314 44 10.0% 13 3.0% 2 0.5%
20 Georgia 380 288 29 7.6% 11 2.9% 1 0.3%
21 Delaware 37 28 4 10.8% 1 2.7% 1 2.7%
21 District of Columbia 37 12 4 10.8% 1 2.7% 0 0.0%
23 Virginia 320 221 36 11.3% 8 2.5% 2 0.6%
23 Arizona** 400 128 36 9.0% 10 2.5% 2 0.5%
25 Pennsylvania 676 356 69 10.2% 16 2.4% 1 0.1%
26 Michigan 864 324 75 8.7% 20 2.3% 1 0.1%
27 Utah 181 71 15 8.3% 4 2.2% 0 0.0%
27 Indiana** 366 235 30 8.2% 8 2.2% 1 0.3%
27 Alabama 372 101 45 12.1% 8 2.2% 1 0.3%
30 Louisiana** 316 57 31 9.8% 6 1.9% 1 0.3%
31 Minnesota 604 155 39 6.5% 11 1.8% 0 0.0%
32 Wyoming**# 63 15 8 12.7% 1 1.6% 0 0.0%
33 South Carolina 200 137 22 11.0% 3 1.5% 1 0.5%
34 New Mexico 138 53 21 15.2% 2 1.4% 0 0.0%
34 Missouri 489 100 41 8.4% 7 1.4% 1 0.2%
36 Tennessee# 320 138 27 8.4% 4 1.3% 2 0.6%
37 Idaho# 165 42 19 11.5% 2 1.2% 1 0.6%
38 Alaska 97 25 7 7.2% 1 1.0% 0 0.0%
39 Ohio** 818 356 46 5.6% 7 0.9% 1 0.1%
40 West Virginia# 121 55 19 15.7% 1 0.8% 0 0.0%
40 Iowa 378 71 47 12.4% 3 0.8% 0 0.0%
42 South Dakota 136 20 13 9.6% 1 0.7% 0 0.0%
42 Arkansas** 274 165 38 13.9% 2 0.7% 0 0.0%
44 Wisconsin 500 240 50 10.0% 3 0.6% 0 0.0%
45 Mississippi 245 66 40 16.3% 1 0.4% 0 0.0%
46 Kansas 318 62 43 13.5% 1 0.3% 1 0.3%
47 Hawaii** 48 35 8 16.7% 0 0.0% 0 0.0%
47 North Dakota 108 12 13 12.0% 0 0.0% 0 0.0%
47 Montana# 114 29 12 10.5% 0 0.0% 0 0.0%
Not ranked Oklahoma*** 411 n.a. n.a. n.a. n.a. n.a. n.a. n.a.
Not ranked Nebraska*** 250 n.a. n.a. n.a. n.a. n.a. n.a. n.a.
Totals 18743 8535 1750 9.3 561 3.0% 100 0.5%


